V for Vendetta was directed by James McTeigue, written by Wachowski, and came out in the year 2006. The film stars Natalie Portman as Evie and Hugo Weaving as V- the protagonist labeled a terrorist by a totalitarian government that has taken control over England in a very vicious way. They have outlawed art; a harsh curfew is imposed upon everyone and police officers that are in control are not abiding by the law themselves, committing heinous crimes.
This movie is based on Alan Moore’s graphic novel which, if you have not read, is filled with a ton of great characters, and has a really great storytelling element to it. One may think of it as just an action-packed extravaganza, and yes, there are great action sequences in V for Vendetta, but it is also a movie that talks about politics and how a government can control its people, and how people can rise up against its government in vengeance when the environment becomes unbearable. It subtly presents a lot of ideas along with fantastic action. The movie has great storytelling, and its performances are stellar.
The movie is set in a “futuristic” fictional world. The year is 2020 and a virus has spread globally (pretty much true of what happened last year). Many Americans lose their life. Britain is ruled by fascist leaders, and they have imposed a curfew on everything. During these times rises a man in a mask named V. He thinks that killing significant dignitaries and bombing important sites will wake up the people against the corrupted government. He tries to commemorate Guy Fawkes who blew up British Parliament in 1605 and hopes to do the same on November the 5th.
V saves a reporter girl (Evie) from rapist policemen on eve of the 5th of November. She forms an alliance with him later in the movie and helps him in his cause. V bombs an old building and later announces on national TV that within 12 months’ time he will blow up the parliament. People who are against the corrupt government should show their support. Either he is a terrorist or a freedom fighter – that is for the audience to judge, I won’t give away much.
The film stars Natalie Portman as Evie and Hugo Weaving as V
This movie came out only five years after the devastating attack of 9/11. This film has a main character labeled as a terrorist and portrays him in a sympathetic light, so we understand his motivations and what he wants to do, and why he’s doing it. It was very brave to release such a movie in that tense environment when labeling anyone a terrorist was easy.
Now granted the world surrounding V in this movie is a futuristic depiction of a fictionalized world in which everything has gone disarray. And there is this one government that is acting like everything is fine. So, in that way you can watch and understand why someone would revolt against it, but also must reiterate that this is a fictional film. Many critics at that time said that this is a disturbing movie and sympathizes with terrorism, which is not much true as it is a fictional world, and it should not be compared to real-life situations.
V for Vendetta has the most phenomenal performances by Hugo Weaving and Natalie Portman. The script for V is great and poetic, filled with quotes such as, “People should not be afraid of their governments. Governments should be afraid of their people.” And the most famous “Remember, remember, the fifth of November, gunpowder treason and plot. I see no reason why the gunpowder treason should ever be forgot.”
All in all, the movie is a classic. It is riveting and exciting to watch. It checks all the boxes being gripping, chilling, intense, exciting, heartbreaking all at once. It is not a big typical action movie, but it has some striking action sequences. The most surprising thing is that even after 15 years, this movie is still relatable regarding what is happening in the world right now. Watching this today is eerily identical to current events.
Space: The last frontier, or perhaps the first doorway towards the heavens. Mankind developed a relation with Space after Yuri Gagarin became the first visitor in Earth’s orbit. Space travel and Space exploration became the next big dream of many nations. But as is the case with many good-intended endeavors, this novel dream was militarized citing security as an exigent factor of Space. No doubt the space programs of almost all countries are basically under the command of their armed forces. But the influence of the militarization aspect in space has grown with the advancement in space.
Among the famous and iconic Films or series to date, Star Trek and Star Wars stand out as the most recognized and loved ones (though I recommend “The Expanse” all the same to understand the theme!). A constant theme of these marvels and many other entertainment pieces is warfare in space. Perhaps mankind’s romance with conflict demands to see it played out in Space as well! So it is inevitable that space exploration and space conflict will go hand in hand. But the preparations of Space warfare lead to the gradual but advanced militarization of space over the recent past decades.
Significance of Space
What makes Space a possible theatre of armed conflict? The answer is multi-faceted and complex. Without going into the details of modern defense strategy, an understanding of the importance of space establishes space as the pivot of modern defense. Space itself is a complex place that requires a high level of sophisticated technology to function and serve various purposes. Space-grade tech. is the penultimate creation of any given time. Many examples show that inventions that were meant to be developed for space eventually found useful applications on Earth. To understand the importance of Space as an armed conflict zone, you only need to look at the top five or top 10 nations that are advanced in space technology are exactly the same that are far ahead of other nations of the world. If you are a power in space, you are a power to be reckoned on Earth.
Present scenario: Militarization of Space
Now if you have the capability to develop high-functioning space tech, it’s logical to explore the Moon and Asteroids for minerals (i.e Rare-Earth Metal that is used in Rechargeable batteries). Just like there is conflict on Earth over the minerals present here, similarly, there is a conflict in space for the same purpose. Although it is still a far-fetched scenario, it’s a very possible one. The present active utilization of space technologies is found in almost all equipment that is used in air, land, and sea warfare (fighter jets, submarines, frigates, aircraft carriers, tanks, missiles, and missile defense systems). Now Cyberspace and space itself are considered battle zone. As the Head of US Strategic Command, General John Hyten, once said: “Space is now a potential battle zone…the Air Force wants to ensure ‘space superiority’ which he says means “freedom from attack and freedom to maneuver.”
To face this challenge, some countries have established dedicated “Space commands” structured in their Strategic defense commands. A Space command manages the Cyberspace threats and works with other entities of the Strategic Command to develop offensive and defensive strategies to mitigate such threats. A basic difference can be identified between a Space command and a space force. The space command develops space systems for cyber warfare, establishes coordination between the conventional and non-conventional armed commands to meet all requirements of modern dimensions of warfare. It does not necessarily develop space weapons for warfare in space (yes literally in space!). Whereas a Space force is a dedicated force that consists of personnel, technology, and weapons to be functional in space warfare. A Space force is structured under the Space command and serves as a specialized branch for space warfare. Long-range missiles (ICBMs-Inter Continental Ballistic missiles) already travel in space as a part of their journey to the target. These types of missiles, space, and cyber systems are already operated by the Space Command so feasible to structure the space force under the space command.
The biggest example of a dedicated space force is the “US Space Force”. It is the world’s first and currently only independent space force. Its personnel are mostly raised from the USAF to serve in this space service branch of the U.S. Armed Forces.
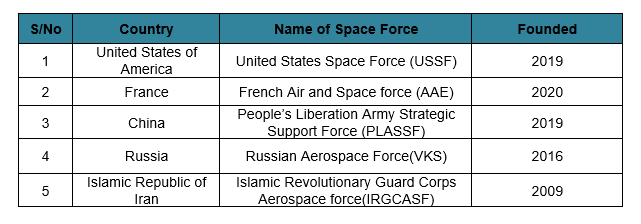
Presently, the following countries have officially declared to constitute a space force. Among these, only the US has officially announced its space force to be an independent entity under the US Space command (a separate force). Each country has structured its Space commands/forces best suited to the structure of its armed forces. We have listed these space forces in terms of the declared number of personnel.
Space forces of different countries
These Aerospace/Space forces are responsible for highly sophisticated technological developments to tackle cyber, space, and electronic warfare. They also perform threat and risk detection, assessments, and mitigation planning in the aerospace domain to protect the assets and interests of their respective countries in air and space.
Many other countries that have functional and profitable space programs also have designated space commands but none of them have declared to have a space force to date. These countries include Canada, United Kingdom, Japan, India, Brazil, Korea, and Peru.
Future scenario: Weaponization of Space
The present space technologies and primitive space weapons give us a good idea of what might be the future of space weaponization. The future (perhaps not so distant) will see more countries entering space and joining suitable “Space alliances” as partners in technology and profit sharing, along with being “space forces” for mutual security in Space.
Every military/force needs weapons. Space forces will be equipped with a large range of Space weapons with cutting-edge technology. Presently, there are many types of weapons under development. Although most of these are highly covert projects whose details are not publicly available. However, the basic operational capabilities are based on present space technologies so it is possible to understand their application. Here are some examples of possible types of Space weapons based on presently known technology:
Types of Space Weapons
As space warfare is an integral dimension to warfare as a whole, so it is governed by the general theory of war as developed in the classics, especially “Clausewitz’s On War” and Sun-Tzu’s “Art of War”. No matter how unfamiliar the military technologies or strange the environment, warfare is still warfare!
Space theorist Everett C. Dolman predicted that “the future lanes of commerce and military lines of communications in space will be the Hohmann transfer orbits between stable spaceports”.
This signifies the critical importance of space weapons that can affect the economy and military of any country. Here we look at some of the most advanced space weapons that have been developed completely or partially to date.
Cyber Warfare
In today’s era of satellites, satellites are no longer just a source to transmit television signals or perform reconnaissance missions! Satellite technology has come a long way during the past couple of decades. The emergence of commercial space companies has cut down the cost of satellite development and launch. Similarly, there has been a rapid advancement in satellite technologies as well. With satellite internet being in the test phase and more countries adopting cyberspace to develop their “integrated warfare systems”. So in a modern warfare scenario on Earth where GPS, BEIDOU satellite systems are pivotal for military communications, whoever has the command on cyberspace and information, easily wins the war before it even starts on Earth! This is the reason why many countries have designated cyber commands in their strategic defense commands. A military force that is blind in cyberspace can be easily crippled to fight on Earth by an adversary that has advanced cyber power.
Electroinic, Electro-magnetic weapons
Advancements in electronics are a major catalyst in all modern weapons. Drones, satellites, Rail-Guns are all good examples of the use of electronic and electro-magnetic technologies in warfare. In space as well, these technologies have played an important role to enhance the impacts of space warfare. One good example is Electro-Magnetic pulse weapons. The deployment of such weapons in space can pose a serious threat to the enemy’s electronic infrastructure on earth, satellites, spacecraft (human or non-human), and even other space weapons. These weapons can cripple enemy electronic systems (on earth and in space) by firing an electromagnetic pulse on their target. Just imagine such an “EMP bomb” attack on a modern city, all infrastructure that is totally operational on electronics will fail to cause mass chaos. Even worse, all military equipment (fighter jets, ground defense systems, etc.) will be taken out of the equation within seconds and the war can be won without firing a single bullet!
Killer Satellites
Russia, United States, China, and India have all tested the “anti-satellite” technology. Even though this technology creates a mass of space junk that can be harmful to an attacking satellite itself, so many “Killer satellites” are self-destructive in the sense that they are built to serve this single purpose. A killer satellite can be mounted with small warheads, types of lasers, jamming technology, or physical collision techniques to destroy an enemy satellite. The target satellite can be any type of satellite i.e communications satellite, reconnaissance satellite, etc.
Re-entry missiles/Objects for terrestrial bombing
The idea of keeping Nuclear warheads in Earth’s orbit isn’t a new one. The US and Russia have pondered on this option for a long time but certain International treaties prohibit them to carry out such an act. A good substitute weapon for an equivalent (or even more) impactful catastrophe is a heavy Tungsten rod placed in orbit and dropped to impact the target location with a great powerful impact. Such weapons are dubbed as “Rods from God”. These weapons can hit their targets on Earth with an equivalence of the impact of a powerful ICBM but without any radiation! An excellent example is the US Air force’s project “Project Thor”. Have a look at this video to understand the most lethal Non-Nuclear weapon possessed by the US:
Project Thor: US’s Most lethal Non-nuclear Weapon!
Conclusion
“There was never a territory in human history that someone didn’t think they could own or make money out of. And that goes for outer space as well…”-David Barnett, 2015
To be realistic, the possibility of space warfare is not an immediate threat. But the course of the advancement of space technology, human space travel, space exploration for precious minerals predicts a near-future of conflict and warfare in the complicated domain of space. Hence spacepower of any nation establishes its dominion over future energy resources and its dominance in modern warfare.
USEFUL READS:
“War in Space: The science and technology behind our next Theater of Conflict”, Linda Dawson, Springer Praxis Books, 2019.
Bambi had been living with her deer family for ages in the forest. They were free to roam about and eat grass whenever they pleased. Their fellow squirrels, insects, frogs, lizards, cats, and other animals were also seen freely prancing around, enjoying the peace and freedom of their home forest.
One day a human camouflaged in the same-colored dress as the soil and trees were seen with a shiny metal tube in his hand. Bambi and her family were frightened and disturbed. They ran away from the mysterious human lurking in the undergrowth. Bambi had encountered a human for the first time.
It was not long before there were humans almost behind every tree or plantation in the forest. The news that a military camp was being set up in the outskirts of the forest spread like wildfire across the animals. The wise Mr. Chimpanzee had spread the news, and almost everybody knew he was always right.
The humans had started cutting a few of the trees, and many of the birds and other animals and insects that nestled there had been snatched from their homes. Some of the birds and deer had even been hunted and killed by the mysterious men clad in green, roasted on the fire, and gobbled up by them. The men had set up tents, huge bags of cloth, onto the ground at certain points in the forest, and they patrolled through almost every pathway, cutting trees and trampling upon everything. Mr. Chimpanzee spied on them and reported that they were preparing to attack the nearby village of humans with those absurd-looking metallic tubes and other similar things he could not identify.
Panic spread among the animals. That would mean more cutting of trees, more killing of animals, and even fire and destruction. Many years ago, they had heard from their animal ancestors; the humans had attacked this land where the forest was. All the trees had almost been cut; animals had died of hunger; some had even suffered the bullets and arrows the humans threw at each other and died in pain on this very forest floor.
Although there had been a state of pandemonium for several days, the humans had left after a few weeks, and the forest land had healed itself over a period of some lengthy years.
Fear filled the heart of every animal in the forest, including Bambi and her deer family, and they had no idea how to cope with the impending doom.
Animal victims of war
To our great remorse, wars and conflicts indeed result in mass devastation. And most of the time, the victims are innocent and have no role in the events going on. One of these unimpeachable sufferers is the wildlife of the area.
Whether plants, forests, crops or vegetation, or animals, both face consequences of loss and destruction that were surely not meant for them. When we talk about the invasion of enemy lands in war, it usually means destroying land and crops. While this is done to weaken the enemy, it is totally forgotten that other life forms are inhabiting the lands, and they should be spared the consequences of human enmity.
To begin with, we should start with the animals which are chosen for services during the war. Soldiers often travel or fight on horses, mules, oxen, bullocks, and elephants in the army. Camels come in handy if the war is taking place in a desert area. Animals are used to carry the soldiers, the food or water supply, and the extra weapons of the army. The cavalry is a crucial part of the army for long-term expeditions.
Pigeons and owls are employed to carry messages between the armies. Dogs are an important part of the military due to their ability to track down enemies and underground bombs and guard their human owners and later dig out victims. It is estimated that about 16 million animals served in the First World War! Another unique example of animals in war is glowworms at nighttime during World War 1 for illumination to read maps and official documents.
Animals are used in military research for the testing of weapons and the impact of injuries as well. For this purpose, pigs, sheep, rodents, rabbits, and primates are used. To check the safety and efficacy of the weapons developed, laboratory testing on these animals is done, and the toxicity of the weapon is evaluated.
Wildlife
Animals and plants living out in the jungles, savannahs, oceans, seas, and other landscapes aren’t exactly directly affected most of the time. It works this way that war and fighting cause the demolition of the environment. Air, water, and land pollution are inevitable. This causes stress on the resources; thus, wildlife perishes. Wildlife is dependent on food, clean water, air, habitat, deforestation, usage of wild plants, and water as food for the soldiers fighting poses competition for the animals. In such circumstances, wildlife survival becomes a challenge, and many animal populations die.
War and fighting cause the demolition of the environment
Zoos
Zoos and conservation sites are meant to be recreational spots for the public. They are for observation, learning, and interacting to some extent with the animals present. In times of war and conflict, such areas are completely neglected, and a state of peril ensues. Animals are either released and used to divert or distract enemy combatants in the conflict zones. They eventually starve, get injured, are killed, or recaptured and put back into the zoo. Basically, they suffer one way or the other.
Livestock
In times of war, activities like farming come to a halt. Livestock cannot be fed and taken care of properly. They are over-worked, killed, or become prey to disease and die off.
Working animals
These are animals that transport people, food, water, and other supplies. Although they are helpful in times of war, they also need provisions and care. Horses, mules, and donkeys come under this category mostly. A pressure for resources and hospitality arises due to increased prisoners and refugees as well. Most animals are killed or die off themselves.
Companion animals
Pets face abandonment or extreme starvation at times of war. They become refugees or are killed in the chaos of war.
To give you an idea of how many animals suffer, it is worth mentioning that many species often go into extinction or become endangered in times of war and many years after.
Can animals ‘feel’ pain and loss?
Yes, of course, they do! They are living creatures with a brain, a nervous system, and perceive, react and coordinate. Animals and living forms of all kinds react to stimuli in their environments. Sensitivity and adaptability are the basic characteristics of life.
Coming to the fact whether animals feel pain and emotions just like humans is worth discussing. Humans undergo a series of emotions like happiness, sadness, worry, anger, etc. As far as mammals are concerned, they do have feelings just like we do. Elephants actually shed tears and stay depressed for days after they have lost a family member. Similarly, a mother cat wails in sorrow for days after she loses a kitten.
Animals are expressive of their feelings. For example, their facial features droop, their eyes well up, and they generally become less interactive.
If we come to smaller animals like reptiles or insects, they feel pain when squatted by us or sprayed and writhing. But their pain does not have a cognitive or emotional perspective like ours. Research has also further confirmed that reptiles are also capable of emotional states like pain, stress, suffering, excitement, fear, frustration, etc.
Of course, all these living things do not have the capacity to express their emotions as we do, but we should stop considering them as some robotic machine or useless life form.
NGOs working for animal protection rights
The most popular one in Pakistan is Todd’s Welfare Society. It was established in 2016 in Lahore, and it offers its services to injured, abandoned, and neglected animals in the city. Kiran Maheen is the founder of this organization, and she established it after she witnessed a dog’s heartless murder by a group of guards. She has named her NGO after her own pet dog, Toddy.
The vision of this NGO is to protect stray animals and aware the public as well. The main services offered are animal rescue, animal relocation, animal aid, foster care, and adoptions and awareness programs.
Another popular NGO is PAWS, Pakistan Animal Welfare Society. It was found in 2004 and is in Karachi. It aims to educate people to be kind and responsible towards animals and take care of the natural environment. PAWS carries out animal rescues, adoptions, and treatments.
Talking on an international level, almost every country now has several NGOs and animal activists spreading awareness against animal protection rights and welfare. In the US, one of these is the American Pet Association, which was established in Georgia in 1991. Its main goal has been to establish pet-friendly communities.
Another such organization in the UK is the Born Free Foundation, which strives to collect charity to support animals in the wild. There are hundreds of other such projects worldwide.
References:
How animals are harmed by armed conflicts and military activities, ceobs.org
Pain in animals
The surprisingly humanlike ways animals feel pain, Liz Langley, National Geographic
Yes, animals think and feel. Here’s how we know. Simon Worrall, National Geographic
Do insects feel pain? Dr Shelly Adamo, Dalhousie University
A review of the scientific literature for evidence of reptile sentience- NCBI
The term “National Security” implies the safety of a nation against terrorism or war. It is defined as the national defense to protect the economy, the inhabitants of a country, and its institutions. Similarly, “Climate change” relates to the cardinal undulations in the climate, its repercussions on the economy, and the lifestyle of people. The effect of climate change on national security is the one we cannot immediately relate to. This article will focus on the implications and the threats that climatic changes constitute to national security.
“Climate change constitutes a serious threat to global security, an immediate risk to our national security, and, make no mistake; it will impact how our military defends our country.”
– Barack Obama
Surprisingly, the national security of several countries has been jeopardized due to the natural disasters fueled by climatic changes. Increasing sea levels in Southeast Asia have intensified the refugee crises, the droughts stirred up the Syrian Civil war (2011), the swift surge in the water volume in the Artic made it a hub for the world powers to compete for water transport facilities and transport routes. Attention must be streamlined over this domain which can potentially wipe out the well-oiled functioning of a nation.
Implications of Climate Change on National Security
Risk at Coastal areas
Food Insecurity
Water Crises
Transportation Issues
Threat to Military and Defense setups
Risk to coastal areas
Extreme weather fluctuations pave the path for unexpected natural disasters encompassing floods, tsunamis, droughts, etc. The elevation of average daily temperatures contributes to global warming and the rapid melting of frozen water bodies.
This elevation of water volume beyond the capacity of water-storing bodies causes floods and storm surges. Such events are a menace as they derange the ongoing operations at naval bases, affecting telecommunications, cease the imports and exports, including military goods, and can cause the delay in the schedule of training institutions.
Hurricane Sandy is one true example of the devastation natural disasters pose on National Security. Else known as Superstorm Sandy or Post-Tropical cyclone Sandy, Hurricane Sandy ransacked the US mid-Atlantic and Northeastern states in October 2012. Marked as one of the worst disasters ever witnessed in US history, Hurricane Sandy spawned more than 20000 household displacements, several causalities, and substantial financial losses.
Hurricane Sandy (2012)
The reverberations of these natural disasters result in a hefty sum of money on providing aid to victims and repair costs. This creates an internal state of urgency in the country, often leading to migrations disrupting the setup of people and topology of the country.
Food Insecurity
The alteration in the patterns of climate change affects the growth and harvest period of food crops, often leading to a lack of profitable output growth or crop damage. Temperature, rainfall, humidity, and soil quality are prime factors determining crop production. Lack of food supplies to feed the affected population and others across the country leads to a major food crisis.
Internal and external security of any nation facing food security crises is at stake as there is less nutrition received by those working in the country’s defense sector. If the military is not well fed, it negatively impacts their ability to carry out their duties: protecting the country constructively. A weak army makes the country prone to additional hazards.
Lack of food supplies to feed the affected population and others across the country leads to a major food crisis.
Africa embodied as one of the most vulnerable continents to climate change, experiences events of food insecurity from time to time. IPCC (Intergovernmental Panel on Climate Change) stated that by 2080, the agricultural productivity in sub-Saharan Africa would depreciate from 21% to 9%.
Climate change will broaden the gap between food production, distribution, and consumption according to the population. Global warming is one of the chief candidates playing its role in escalating the severity of food crises in Africa. The Statistical Review of World Energy 2016 predicts global warming to pose detrimental effects on food security, putting almost 5 million to 170 million hungry lives at stake by 2080.
Moreover, it undermines a country’s solidarity as people fight for their survival daily. Such a scenario leads to a shortfall of attention and zeal towards other system areas, including military, education, and economic development.
Water Crises
At first glance, water crises seem unrelated to National security, but there is a deep connection between both. According to the prognosis of the US Intelligence community, by 2030, approximately 1/3rd of the world’s population will reside near water basins where “water deficit will be larger than 50%”. Soaring daily temperatures and scarring ozone layer end up with rapid melting of frozen water bodies, disturbing the water cycle thus leading to floods.
A dearth of fresh, clean water or excess unclean water are challenges for any country. Droughts play a vital role in severing the water scarcity crises. Drylands or series of droughts automatically raise the demand for water supply.
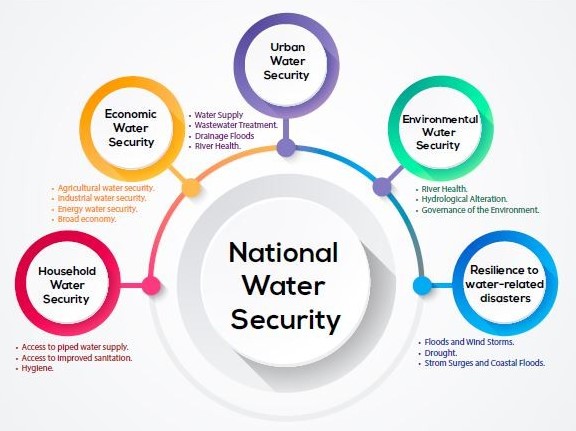
National water security framework
Water bodies are connected or shared between different countries. Political incompatibilities, unhealthy competition in business and economic growth, or instincts of revenge and enmity for past events can be detrimental to National Security.
A great example is the famous Indus Waters crisis that led to the “Indus Waters Treaty,” which aimed to diffuse the tension over the water access between Pakistan and India. Post-1947 partition, when there was a topographical division between India and Pakistan, India got control over the upstream barrages, whose water later entered Pakistan.
There were disputes over the Indus River water distribution between both countries as India stopped water flow into Pakistan. For a newly established country, such a water crisis was a massive setback for the government. A treaty, known as the “Indus Waters Treaty, 1960,” was signed between Pakistan and India to solve the issue. One of the terms of this treaty gave Pakistan control over the western rivers, The Indus, Jhelum, and Chenab, while India got their hands on the eastern tributaries, the Ravi, Sutlej, and Beas.
With an exponentially rising population, the ample use of water in routine life, the consequences of these water crises can lead to geopolitical instability, population migration, and territorial segregation, all of which are vicious for national security.
Transportation Issues
The transport infrastructure of a given region is built keeping in mind the weather pattern of the area. The nature of weather markedly influences the longevity and construction of the transportation routes. For instance, extremely humid and warm weather can delay railway tracks, bridges, or roads.
Continuous snowfall or floods can weaken the base of bridges, make roads less usable, and potentially halt regular activities. Furthermore, vandalization of transport routes, the repair costs, and the repair time is an additional strain on the country’s finances and resources.
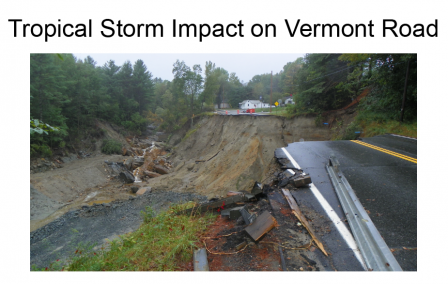
Tropical Storm Irene damaged 2,000 roads, 1,000 culverts, and 200 miles of rail, and closed 200 bridges in Vermont in 2011. Source: USGCRP (2014)
Climatic shifts, primarily an increase in the temperature at Earth’s core, cause the tectonic plates to move. This movement results in earthquakes bring along several losses. The 2011 earthquake in Christchurch, New Zealand, the deadliest one ever recorded, took the lives of 185 people accompanied by huge infrastructure damages. Although the magnitude of this earthquake was 6.2, it still poses significant damage as it hit directly underneath the city.
The copious amount of damage earthquakes and other natural disasters bring along takes months to restore. Destruction of transport routes makes it difficult for medical teams to reach the affected area and provide medical attention to the victims. Delivery of food, sanitation facilities, raw construction materials, and machinery gets strenuous.
But is National Security threatened by transportation issues? Yes! Poor transport infrastructure makes access to remote areas difficult. Quick access to the most isolated areas is a necessity and is a crucial aspect of counter-terrorism. Transport of military, freight, artillery on an immediate basis is also a must for national security.
Moreover, failure to secure the transport routes provides a gateway for illegal activities (extortion, kidnapping, smuggling), which pose a considerable risk to the country’s security. In addition to this, the use of transportation assets to carry out terrorist attacks is a matter of concern.
Threat to military and defense setups
When an episode of natural disaster hits a region, the National defense department is all hands-on to provide immediate relief. Such action requires a handsome amount of funding accompanied by resources. However, if the frequency of such natural disasters accelerates, the defense department is impaired from executing its duties efficiently.
Their focus is diverted from the primary National security missions to providing immediate interstate sustenance. Such shift of attention threatens National Security and poses additional underlying concerns.
Furthermore, the aftermath of natural disasters severely hampers the functioning of the National defense training institutions.
The ability to complete missions, maintenance checks, and necessary installations is troubled. The unannounced natural disasters affect the preplanned tasks resulting in an overall delay. Moreover, the financial losses are enormous. A great example of such a catastrophe is Hurricane Michael 2019, which contributed billions of dollars to Tyndall Air Force Base and $450 million worth of damage to the Pensacola base in 2020.
Is there a way out?
When it comes to national security, taking immediate action to strengthen it is the priority of any nation. Although climate change has been one of the grave issues this planet experiences, its impact on national security intensifies its danger. Government must draft an action plan, providing the defense and military departments with regular updates and reports about climate change so that activities are executed according to it. Furthermore, the transport department must construct the transport routes after in-depth study about the area and the type of weather the area is most prone to.
Framing down laws, rules, and regulations is meaningless unless there is proper implementation without corruption. To ensure the country’s safety, there should be internal and external security to eradicate terrorism. The role of the general population is paramount in ensuring national security. Efforts should be made to minimize the use of fossil fuels, the emission of greenhouse gases and promote environmentally friendly materials to curtail climatic shifts.
Climate change is not restricted to environmental protection; it’s about national security as well!
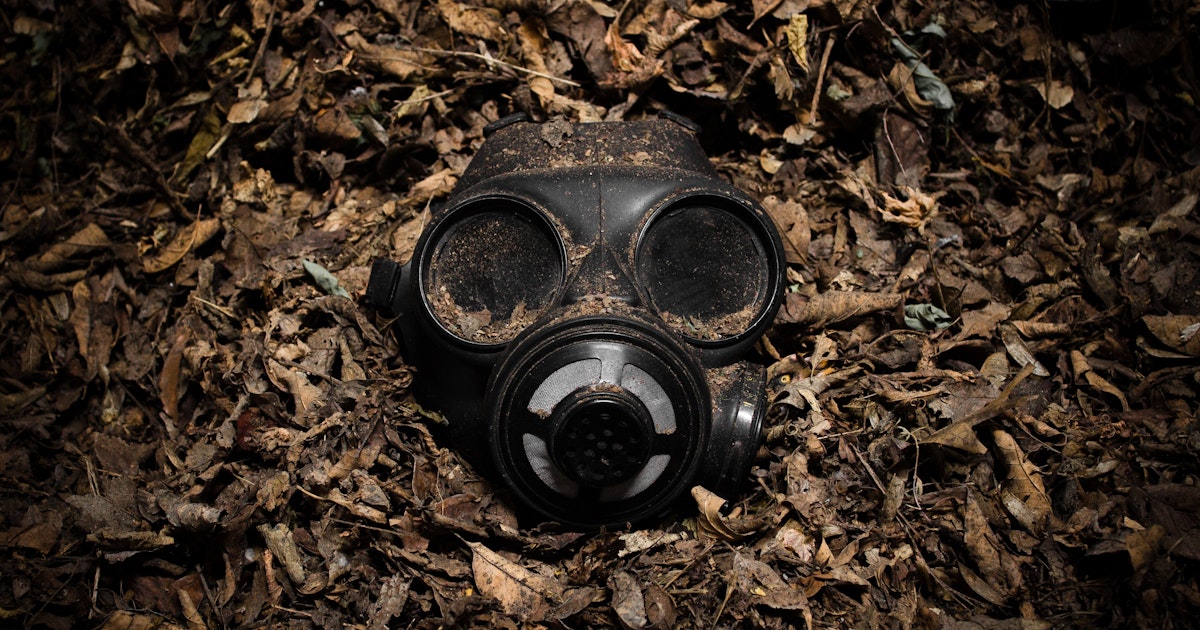
Biological weapons, termed as bioweapons or biological threat agents, are living organisms or replicating entities such as bacteria, viruses, fungi, and toxins deliberately produced and released to cause disease or death in humans, plants, or animals. Bioweapon is cheaper than high-tech equipment and armor and can easily attack the target, usually unseen. This weapon can be used to gain strategic advantages over the enemy either through threats or their actual deployment. However, their harms outweigh their benefits, due to which their use has been strictly prohibited globally.
Evidence lists several wars in history deploying biological weapons. Photo Massive Science
An overview of the history of Bioterrorism
Bioterrorism is when bioweapons are deliberately created by mutating the naturally existing bioagents or increasing their disease-causing capacity, or making them resistant to existing therapeutics with the intent of using them to destroy the enemy or their land. Several international pacts and treaties, including the customary international humanitarian law and the 1972 Biological Weapons Convention (BWC), have essentially prohibited offensive biological warfare and have declared the use of biological agents in armed conflict as a war crime.3-5 This prohibition came as a consequence of the “not so pleasant” history of using biological weapons in the past.
Evidence lists several wars in history deploying biological weapons. An example as early as the 1300s, in the Mongolian era, tells us about the death of many Mongol soldiers at the hands of the plague. Which is consequently believed by the researchers to have been the cause behind the Black Death plague in Europe, killing nearly 25 million Europeans.6-9 Another early example of the deployment of bioweapons comes from 1763, where the British soldiers attempted to spread smallpox against the Native Americans by giving them blankets borrowed from the hospitals having patients with smallpox.
Although this was an indirect move, the intent was clear of using smallpox as a bioweapon.10 A couple of bioweapons, including anthrax spores, brucellosis, and botulism toxins, were being prepared to be used in World War II; however, fortunately, the war ended before their utilization, or perhaps if utilized, the documentation was destroyed to remove any form of record.11 Bioweapons, although easy and cheaper to produce in comparison to armor, are not as simple as they appear. They can be unpredictable and out of control when used on a battlefield, and there’s a fair chance of both parties being affected. Once gotten out of hand, it can be extremely difficult or even impossible to end a bio-war, leading to strict prohibitions of deployment of any bioweapons anywhere in the world.
The conspiracy believers suspect that the “bat coronavirus” has been genetically engineered to cause the disease in humans with an increased infectivity rate.
COVID-19; a pandemic or bio-war
The Lab-leak theory
Jumping onto recent times, the most crucial and acute issue globally is the current SARS-CoV2 (COVID-19) pandemic, sweeping through the world since November 2019. A great deal of conspiracies has surrounded this current COVID-19 pandemic, causing suspicion on the virus’s origin, portraying it to be an attempt of bioterrorism or a biowarfare experiment gone wrong rather than a mere disease outbreak. The most heated conspiracy theory regarding this pandemic calls this virus a “bioweapon” designed in a Chinese lab.
This speculation parallels the co-incidence of a highly sensitive gain-of-function lab in Wuhan (Wuhan Institute of Virology). China is located close to the wet market from where the SARS-CoV2 has been allegedly transferred into humans.13 Gain-of-function research (GoFR) is a form of medical research where an organism or a gene is modified under lab conditions to gain a new function or enhance its existing function. Gain-of-function research carries inherent threats to biosafety and security and is referred to as dual-use research of concern (DURC).14,15
Hence, the presence of this advanced virology lab in Wuhan that was already known to be studying coronaviruses in bats fed these accusations of China’s intentional release of a more virulent form of the existing coronavirus into the humans. The conspiracy believers suspect that the “bat coronavirus” has been genetically engineered to cause the disease in humans with an increased infectivity rate.13
To investigate this, a team of experts had arrived in Wuhan earlier this year and had stayed there for 12 days investigating and looking into every possible detail. The report published by WHO following this visit completely dismissed this conspiracy and called for further research to identify the true origin of the virus. On the other hand, US officials and policymakers remained unsatisfied with the findings of this report.
Many prominent scientists also criticized these findings and demanded a more serious investigation into the lab-leak issue. Believers of the “lab-leak” theory have a divided view; some think the virus was directly picked up from the lab, while others believe the virus had leaked from the lab and had reached the wet market where the early cases of it emerged.16 However, to date, the origin of the virus remains unclear, with a large number of scientists and investigators putting plenty of their efforts into getting all the answers.
Antidots against conspiracies. Photo CSS Blog
Differentiating a pandemic from a bio-war
It is noteworthy that multiple similarities exist between a natural viral pandemic and the deliberate release of bioweapons worldwide. Both have a similar effect of causing panic, frustration, and despair among the public and the healthcare workers, overwhelming the healthcare systems. However, it is worth acknowledging that not all disease outbreaks are a deliberate attempt of bioterrorism with history providing sufficient examples of naturally occurring pandemics like the Middle Eastern Respiratory Syndrome (2015-ongoing), Severe acute respiratory syndrome (2002-2003), Hong Kong Flu (1968-1970) and the list goes on dating back to millions of years.17
Hence, epidemiological indicators need to be closely monitored to distinguish a pandemic from a deliberate bioweapon attack. It is important to monitor any unusual pattern in the geographic distribution of the disease or its behavioral differences in certain age groups of people, for example, the outbreak of influenza during the months of winter in most parts of the world is normal, but the spread of pulmonary anthrax in the Eastern Coast of US is alarming.
Hence, a significant number of healthcare experts and scientists advocate that there are no unusual epidemiological indicators about the current COVID-19 pandemic as the coronaviruses commonly occur in winters, just like they did in November 2019 in China. Moreover, it is believed to be very likely that SARS CoV-2 evolved from horseshoe bats that are abundantly consumed in China as part of their culture, causing the transfer of the virus from bats into humans, possibly marking the beginning of this pandemic rather than any offensive political move or an attempt of bio-war.18,19
Conclusion:
Bioterrorism or biowarfare is an extensive topic, and it was beyond the scope of this article to touch upon all of its aspects in detail. However, an utmost effort was made to succinctly summarize the key areas of this vast topic, giving a broad overview of the history of bioterrorism and, most importantly, touching upon its COVID-19 conspiracy theories. It is clear from the given arguments that bioweapons are cheaper and easier to develop than other forms of war equipment.
However, their relative characteristics of easily going out of control and the dread of being unable to put an end to a bio-war have resulted in the strict prohibition of the use of any bioweapons globally. It is important to note that there is a fine line between “defensive” and “offensive” biological research, and there are ongoing debates globally. Committees are being formed to strictly ensure that no offensive biological research is being carried out worldwide.
^ Customary Internal Humanitarian Law, Vol. II: Practice, Part 1 (eds. Jean-Marie Henckaerts & Louise Doswald-Beck: Cambridge University Press, 2005), pp. 1607–10.
^ Andrew G. Robertson, and Laura J. Robertson. “From asps to allegations: biological warfare in history,” Military medicine (1995) 160#8 pp: 369-373.
^ Rakibul Hasan, “Biological Weapons: covert threats to Global Health Security.” Asian Journal of Multidisciplinary Studies (2014) 2#9 p 38. onlineArchived 17 December 2014 at the Wayback Machine
Ranlet, P (2000). “The British, the Indians, and smallpox: what actually happened at Fort Pitt in 1763?”. Pennsylvania History. 67 (3): 427–441. PMID17216901.
Kaszeta D. Perspective | no, the coronavirus is not a biological weapon [Internet]. The Washington Post. WP Company; 2020. Available from: https://www.washingtonpost.com/outlook/2020/04/26/no-coronavirus-is-not-biological-weapon/
Pakistan entered the Space Age, ahead of all Islamic, in fact, all developing countries, on 7th June 1962 with a bang, when its first two-stage rocket named REHBAR –1 lit up the night sky over the Baluchistan Coast rising up to a height of 80 miles, releasing an Orange coloured trail of sodium vapour lit up by the rays of the setting sun which could be seen from Karachi and hundreds of miles along the coast of Pakistan.
Scientia: Let us know about the details of how did you and Dr. Salam get in touch with the officials at NASA?
Dr. Tariq Mustafa: In mid-September 1961, I was posted at the US Atomic Energy Commission Laboratories at Oak Ridge, Tennessee, as a USAID fellow from Pakistan. I had joined Oak Ridge in Jan 1960 for a two-year fellowship and after completing about 21 months.
In the middle of July 1961, I received a call from Washington DC, the person at the other end identifying himself as no other than Prof Abdus Salam said “Look Tariq it might come as a surprise but you have to come to Washington earliest and join me tomorrow morning in an important meeting”.
He made it clear that he did not care how I get there, whether by running or hitchhiking, but I better get there soon. So next morning at 10 am, I joined Prof Salam and we found ourselves going into the spanking new Headquarters of NASA the newly formed National Aeronautics and Space Agency of America.
Our meeting was with a dynamic young Director of International Relations Mr. Arnold Frutkin who told Professor Abdus Salam that luckily for us, you are accompanying President Ayub Khan who was on an official visit to the USA. And President Kennedy of the US had, a short time before, announced that he was committing the US to land a man on the moon and return him safely to earth before the decade of 60s was out by the end of 1969.
NASA was directed to complete this program and they had already started in real earnest. Mr. Frutkin explained that this was a program that would encompass the whole of the earth because their rockets will have to be placed in Earth orbit before being propelled towards the moon and this required knowledge of the properties of the Earth’s upper atmosphere, particularly the wind speeds and directions at the higher levels.
NASA scientists have found that the area around the Indian Ocean was a “black hole” since practically no data was available on the upper atmosphere in this entire region and this was crucial for this program.
We were told that NASA invited selected countries of the region to set up rocket ranges and carry out scientific experiments. US side offered to supply free launching equipment and rockets in lieu of sharing raw data obtained from the experiments.
(L-R): AZ Farooqui (Communication), Rehmatullah (Meteorology), Dr. Tariq Mustafa (Team Leader), Salim Mehmud (Electronics), Sikander Zaman (Engineering) standing in front of the Rehbar-II rocket. Credits: Dr. Mustafa
Prof Salam looked at me and said in Punjabi, his favorite language “Tariq, Tera ki khayal ai” (Tariq, what do you think?) I replied to him in Punjabi “kay ye to jee Hamara khawab pura ho jai ga” (That this will amount to our dream coming true). Mr. Frutkin who was watching intently, caught on to it at once and said, “from his face, it appears the young man is quite keen, am I right?” and Prof Salam nodded and Frutkin said that in that case, we need not lose any time.
I was put on a NASA flight, the same afternoon, to visit their Wallops Island Range where I was briefed about the launch equipment, rockets, and whatever else needed for the experimentation.
Scientia: Would you like to brief us about the proceedings that led to the historic launch of Rehbar-1 in a mere period of nine months?
Dr. Tariq Mustafa: It is a source of great satisfaction, nay pride, that Pakistan not only kept this momentum but in fact totally surprised the U.S. side by completing the project in 9 months and launching the Sodium Trail experiments in June’ 62, ahead of all developing countries.
Our first challenge was forming a dedicated team. We put together a small and hard-hitting team which included Salim Mehmud, a specialist in electronics and instrumentation.
We got two new members from PAEC Karachi, one was Mr. A. Z. Farooqui a retd Flight Lt. of the Pakistan Air Force, to cover the communications side, and Sikandar Zaman a young promising mechanical engineer for the rocket assembly and launch operations. And a fifth member was an experienced meteorologist Mr. Rehmatullah, a Deputy Director in the Department of Meteorology who was to cover the scientific side.
Our team was selected and assembled at Wallops within weeks and started their work in earnest, where we went through intensive training and learning and Pakistan end in Karachi where plans were developed for the design and layout of the Rocket Range and its infrastructure and buildings.
NASA people told us that the launcher and the rockets were based on the Nike Ajax anti-aircraft weapon system and that we were allowed to take the Nike Booster Rocket from that system along with some of the control instrumentation.
Scientia: Let us know the details of the Sodium vapour experiment being done with the launch of Rehbar-One launch?
Dr. Tariq Mustafa: Concerning the scientific experiment, it was mutually decided that the first experiment would be the Sodium Vapour Trail experiment.
It consisted of a container of sodium which was ignited a few minutes after rocket launch when the rocket had climbed up to a height of about 50 km and then it discharged a Sodium Vapour trail from a height of 50 miles up to its apogee of 80 miles or so. This sodium trail was launched precisely at a calculated time after sunset when the sun had set on the earth at Sonmaini, but the sun was still shining between the heights of 50 to 80 miles.
The Sodium vapour would be lit up like a bright yellow trail which would then be blown about by the upper atmospheric winds and it would form a pattern in the sky and by photographing and analyzing that pattern we could work back and determine what the wind structure at that height was.
It was the combined analysis of the synoptic imagery- that means simultaneous photographs taken from the three sites would give us the wind shear and the wind speeds, which was the data we were looking for through this experiment.
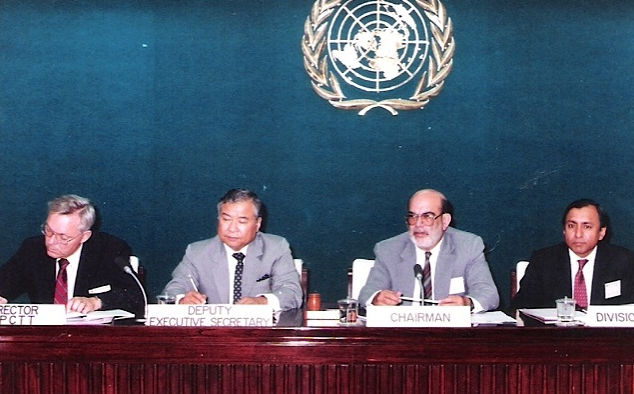
Tariq Mustafa presiding over the meeting of the Board of Governors of the Asian Pacific center for Technology Transfer (APCTT) at Bangkok- c.1992. Credits: Dr. Mustafa
We asked Pakistan Air Force for support in aerial photography. The same cameras they used for air to ground photography would be used from the ground up. We provided radio means of communications from the Sonmiani launchpad control room to each of these photography stations that were spread far away at a 100 miles distance from Bholari and Uthal to different areas around Sonmiani. They were all connected through radio communications.
Scientia: Tell us about the Hurdle you and your team faced while working in scorching and humid weather of Baluchistan with mere living facilities?
Dr. Tariq Mustafa: No doubt, there were difficulties. But the choice of Balochistan was simple. The rocket range had to be on the coast. Because you fire the rockets into the sea and it cannot be done in a populated area or on land. Secondly, in the very meetings in Washington, interestingly, it was president Ayub who casually remarked that if you have to select the range, in on the coast and Balochistan, then you can have it at Sonmiani where the army already has an artillery range. That cue was very good for us.
Firstly, it meant permission from the army, which normally takes time. And, for other locations, we would have had to survey the whole coast and spend time, effort, and energy. So, the availability of the Sonmiani artillery rage was a boom for us. If that were not available, then I don’t think that we could have finished the project in nine months.
The basic infrastructure was available. But the weather conditions cannot be changed. We knew the monsoons come in early June, and the NASA Apollo program very much wanted that this data should become available as early as possible.
Pakistan Atomic Energy Commission provided all the resources at that time. SUPARCO did not exist in 1961. Had the commission or NASA’s support not been there all this would not have been possible.
The buildings were constructed by MES, but all the installations, the rocket fixture, the launchers, the power supplies, had to be created by us. And this team had to work day and night to meet the deadline.
We would get up at Fajar (early morning), go down to the range area, do the work up to about 12 o’clock. And then we would break off, come back to the army range, where we have been given accommodation and had lunch and a siesta. But then go back around four o’clock, and then continue working till required.
So, if Bezos wants to do it and has the resources; go ahead. But for a country like Pakistan, I would certainly think that this would be extravagant and not recommended. If any Pakistani has the resources and buy a ticket; best of luck to him. But that is not a matter for the state to decide.
Sometimes it was 12 o’clock at night. There was a deadline but people were motivated. And that’s how it came to be.
Scientia: Given that SUPARCO was established way before ISRO, why do you think we lagged behind? What could we have done to improve our position in the race for space or even in the development of technologies?
Dr. Tariq Mustafa: The answer is simple enough. India is a large country, seven times our population and with more than 10 times our economic resources. They want a certain image, and they have provided the matching resources to ISRO. Pakistan, on the other hand, couldn’t spare any finances for space like that. Earlier, we luckily got the support of NASA and jumped on that opportunity. Otherwise, I doubt whether Pakistan independently would have had much of a space program.
So, we have to work within our resources. And there it is best to go in for projects and programs, which give you some developmental dividends, such for Communications, Navigation, Meteorology, Agriculture, Planning, etc. Otherwise going for the moon or Mars does not give you any short-term economic benefits. Pakistan can ill afford that. I think, with its limited resources, it is best for Pakistan to concentrate on applications and not on showy projects.
Dr. Tariq Mustafa (seated at the front) at the first post-graduate International Reactor School of the United Kingdom Atomic Energy Authority at Harwell, near Oxford- 1957. Credits: Dr. Mustafa
Scientia: These days there has been this buzz around the space tourism industry. Do you think that this should have some solid objectives, rather than just getting the status of having visited the space?
Dr. Tariq Mustafa: All that is a matter of resources. As I’ve already stated, in my opinion, state resources should go towards development-oriented projects. Now, as far as the private sector is concerned, they are free. If somebody wants to invest in tourism; why not?
So, if Bezos wants to do it and has the resources; go ahead. But for a country like Pakistan, I would certainly think that this would be extravagant and not recommended. If any Pakistani has the resources and buy a ticket; best of luck to him. But that is not a matter for the state to decide.
I remember there were these massive processions coming out of Mochi Gate every Friday. And I would join them regularly. That was the spirit of the day. It is unfortunate that that spirit has been allowed to dissipate.
Scientia: SUPARCO is working on rocket technologies as we see in the news but what do you think of its current and whether we should work on other defense technologies, rather than just the rockets or radars, etc. What else should we be focusing on to improve our defense system?
Dr. Tariq Mustafa: That is for the defense establishment to spell out. As far as SUPARCO’s role is concerned, they are supportive of the rocket part. And as far as I know, I think that cooperation is pretty good. The results speak for themselves. In fact, Pakistan has done remarkably. The world recognizes that Pakistan today, in response to the Indian provocations, has been able to match on the nuclear side, and we can no longer be blackmail. We can deter nuclear aggression.
If Pakistan had not developed its new capabilities, I think the pressure on us by our unfriendly neighbors would have been far stronger. In fact, one wishes that Pakistan would have done equally well, on the civilian developmental side.
Scientia: Speaking of SUPARCO and the work you did before, we see that the team was very dedicated and hard-working. Do you think that we can have individuals in this generation and era, who have the same enthusiasm to work for the country as you and your team did back in the 1960s?
Dr. Tariq Mustafa: I see no reason why the younger generation should not be equally keen. Yes, it is true that in our days, at least I was a product of the creation of Pakistan’s days. Born in the 30s, I remember I was 13 years old when Pakistan came into existence. I was in Lahore. And I remember there were these massive processions coming out of Mochi Gate every Friday. And I would join them regularly. That was the spirit of the day. It is unfortunate that that spirit has been allowed to dissipate.
But in principle, I see no reason why the younger generation of today should not be equally enthusiastic. It boils down probably to leadership. I think, with great good leadership, there is no reason that the youth of today cannot produce similar results. And from what we see, at least on the strategic side, we have done pretty well. I repeat on the industrial development of the country, we’ve not been able to do so well. Pakistan through the 60s was doing extremely well.
The world looked at us as a role model; Pakistan’s GDP was growing, then, unfortunately, with the 71 happenings in East Pakistan, etc., the growth rate went down. So many factors are responsible, but primarily, I think what is in our control is our leadership. And that is where we have not been able to do a good job.
Scientia: Some prominent universities of Pakistan providing space science education. Still, the practical work is restricted due to our decade-old educational system and mere research facilities. This is why our passionate youth moves abroad. How can we effectively deal with this situation?
Dr. Tariq Mustafa: If there is developmental activity within the country, there will be room for jobs and need for specialists, etc. Having said that, I personally don’t see any harm in people going abroad if they do not find opportunities at home.
I think sometimes we don’t give due credit to our expatriate community. Without their input, Pakistan would have been in a worse condition. So, thinking that there is brain drain is a disadvantage. But it is true that we want development at home. And for that, there is a need for strengthening the research institutions.
The tradition of research is weak in Pakistan and has been weak for centuries in this region of the world. We need to find a solution to that. That is a challenge, again, for leadership. But again, I repeat, I think if we can, we should produce as many specialists as possible, preferably suited to first to meet our own requirements.
Scientia: In the 1960s, there was a lot of collaboration and scientists were very keen on working with each other. Unfortunately, we don’t see it a lot these days. Why aren’t we collaborating with those who are already established and have the resources?
Dr. Tariq Mustafa: In principle, I see no reason and I’m sure cooperation is taking place with the countries abroad. But that is also tied up with the political situation. Remember, there was cooperation from NASA, and without NASA’s help, I am the first one to acknowledge that I don’t think Pakistan would have even entered this field.
But that was because it suited NASA. It was no favor to Pakistan; they did for their Apollo program. Let’s be clear on that. It was of mutual benefit. You see, they think that now we have, and I suppose to some extent it is true, given first priority to a strategic program that does not fit into the American scheme of things.
Even during our days, I remember that when we wanted to manufacture rockets in Pakistan, NASA’s help was not forthcoming. So, we had to look to other countries. And finally, we entered into a technology agreement, purchasing from France. And it was on French technology, that our rocket production plant in Maripur was established. So, it’s a matter of finding opportunities. That’s how cooperation proceeds ahead.
Another factor that adversely affected, Pakistan is this so-called terrorist issue. I don’t really want to go into that aspect. But the fallout of Iraq and Afghanistan has been very detrimental to Pakistan’s development. It has slowed down our economic development and investment from other countries. The fallout of the instability, and wars in the Middle East, was very damaging to Pakistan. We lost these years. Even Bangladesh today is ahead of us because they’ve had peace. We haven’t had peace in the last 30 years.
Scientia: Finally, what is your vision for the future of Pakistan?
Dr. Tariq Mustafa: One can only pray that there is peace in the country and in the neighborhood. We have to depend on friendly technology transfers. The speed of development of the world is so fast, things have been accelerating. The world is now almost on an exponential curve. No one can depend on their own resources. It has to be cooperation. And for that good peaceful conditions, law and order are necessary. These are all requirements on the political level.
But at the scientific level, of course, I think we have to step up learning. We have to remember the spirit which animated our ancestors. Muslim scientists led the world for at least 800 years. That wasn’t done just by being followers. That was done by good leadership, hard work, and open minds. Our education system has to be opened up that way. If we can do that, there is no reason why we cannot go back to the kind of pace that we had developed in the 60s. It comes down to good leadership and hopefully, a good political environment.
Science has been associating with war for a long. In the ancient age, the inventors like Archimedes and Leonardo turned their research for figuring out some of the significant problems of the fight of that historical period.
Archimedes had made use of his mathematical knowledge and designed a Catapult to launch rocks, timbers, and other heavy objects over the great distance between the city walls and moored enemy ships. His war machines played a vital role in the Roman army’s defeat when they attacked Syracuse, the hometown of Archimedes. Leonardo Da Vinci had also designed a giant crossbow, a tank, a steam-powered cannon, and deviously created horse-powered carts and weapon diagrams.
An example is climatology, since the weather condition and predictions affected military operations, especially in airstrikes. Several military-funded research projects were initiated in the 19th century to study weather modification.
The war influenced not only the specific scientific research projects but also the whole direction of technological evolution. During the first several centuries of modern science, technological advancement usually revolves around the scientific explanation.
It is very likely that the research breakthroughs will soon transform the technological battlefield. The most destructive period of history tends to be those when means of aggression have earned the upper hand in the art of waging war.”
Nuclear physics is a prime example of this interaction. The considerable interest of researchers in atomic science is due to the urge to make a devastating weapon against the enemy. When several governments launched nuclear power projects, they provided colossal funding and available resources for expanding training and research work in nuclear science.
Another era of technological innovation that is significantly influenced by military imperatives is computer science. During the 40’s and afterward, the military interest was primarily in mainframe computers to crunch numbers for solving problems related to nuclear weapon designs and forming more efficient nuclear-war strategies.
In the modern era, science and technology extended to robotics, artificial intelligence, biotechnology, synthetic biology, neurosciences, Nanotechnology, 3D printing, data sciences, and the interaction of each of them, ‘cyber security’.
The concept and underlying strategic importance were articulated at the multinational level in NATO’s May 2010 new strategic concept paper. This paper concluded that “it is very likely that the research breakthroughs will soon transform the technological battlefield. The most destructive period of history tends to be those when means of aggression have earned the upper hand in the art of waging war.”
Moreover, the emerging trends of using new technologies for war strategies have underlined a couple of unresolved security puzzles that have implications for international security, defense policies, deterrence, governance, and arms control.
Summing up all these issues, Scientia Pakistan brings its special edition on “Defense technology”, on the eve of Pakistan’s Defense Day. The real feast of this edition is the interview of Dr. Tariq Mustafa, a senior space scientist from Pakistan. He briefly speaks on Pakistan’s contribution to NASA’s Apollo series and the launch of Pakistan’s first rocket, ‘Rehbar-1’in 1962. With this launch, Pakistan assembled essential data for the climate study over the Arabian sea.
Other lead stories are joint all-domain warfare, bioterrorism and its role in the conspiracy creation during the pandemics, national security and climate change, impacts of wars on wildlife, cybersecurity, future of security in space, environmental defense, and much more.
So gear up, tighten your belts, and start your journey to a beautiful read. Have a lovely week ahead.
Internet of Things or for Short IOT is the profession of smart objects including cars, home appliances and devices which connects physical world to the digital world whereby human interacts with these devices to gain benefits, improve their consumer experience. For example, a home appliance that reduce monthly bills by managing resource usage by automatically turning off the lights when you leave home or by adjusting the room temperature according to the current climate. Another example of IOT is the famous baby app mimo which enables parents to check on their babies while giving them aa handy analytic style overview of the breathing and sleep patterns over time.
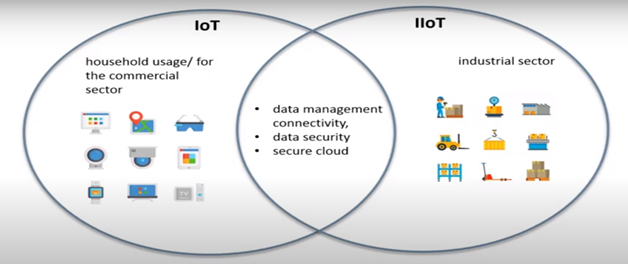
The difference between Internet of Things (IOT) and Industrial Internet of Things (IIOT) is their usages. Where IoT is more commonly used for consumer usage, IIOT is used for industrial purposes such as manufacturing, supply chain monitor and management system. IIOT uses more sensitive and precise sensors. Hence, IOT is intended exclusively for household and commercial sector while IIOT pertains to the industrial sector. Bu they both have common concepts like data management, connectivity data security and secure cloud.
IOT Market
IOT is the fastest growing global industry. In the year 2020 its net worth was USD 308.97 billion and is expected to be worth USD 1,463.19 billion by 2027 at 24.9% CAGR. Even in the most troubled of the years 2020 IOT industry showed resilience and showed growth of 23% in 2020 and so according to the report of Internet of Things (IOT), market size, Share and Covid-19 impact Analysis by the business insight the IOT industry is expected to be worth USD 381.30 billion by the end of 2021. According to the report the resilience of IOT industry during the Pandemic is due ti its growing demand and growth in the world.
The IOT works like a global infrastructure to provide for the information society. It enables services to connect with each other on basis of advanced and current communication technology. IOT industry has a huge potential of expansion and development that is expected to open up new opportunities and revenues for humans. IOT’s feature to operate independently without any human intervention will open up new avenues for businesses management and add efficiency. Even IOT technology is now being used against the Pandemic.
Covid-19 and IOT Technology
Hospitals and paramedic staff across China are using connected thermometers, temperature sensors, drones, and telemedicine to fight pandemic and provide the patients and public with the right services to protect them against the virus.
The paramedic staff at Shanghai Hospital is using connected thermometers in order to monitor the temperatures of the staff and the patients. They and other hospitals in China have also employed temperature sensors to reduce the risks of staff members being exposed to the covid patient. Whereas telemedicine and drones are also being used to protect the frontline workers. For example, drones were used to monitor the citizens during the lockdown while South Korea with the help of IOT controlled drones cleaned the outbreak hotspot Daegu. Moreover, in India and Al startup company Asimov Robotics employed robots at various public places in the city of Kerala and office’s entrances to deliver public health message and sanitizer.
However, despite the new innovative usage of IOT technology the IOT market experienced a setback in the initial period of the pandemic due to the supply chain disruption which was in turn caused by the transport and labor unavailability. But with the current pattern and innovative adaptations companies are getting back on track. Below graph shows the latest and expected trends of the IOT industry.
The graph is taken from www.furtunebusinessinsights.com
Smart Cities and the Rising Market of IOT
With increasing urbanization and digitalization, the demand of IOT technology is rising rapidly. Shifts towards smart cities and digital ecosystem has expected to the demand of IOT devices especially for its management features. Currently IOT devices and technology is being used for air and water quality control, observing mobility and infrastructures and public utilities. For instance, in 2019 a European based company European Innovation Partnerships for Smart cities (https://www.fortunebusinessinsights.com/industry-reports/smart-cities-market-100610) and communities (EIP-SCC) invested about 1.12 billion dollars to construct about 200+ Smart Cities in Europe.
Europe is the leading region in development of smart cities and so is the inspiration for the world and its members for smart cities and IOT technology. According to Business Insider EU commission in 2019 had worth USD 439.6 million in these initiatives.
Asia Pacific and IOT Market
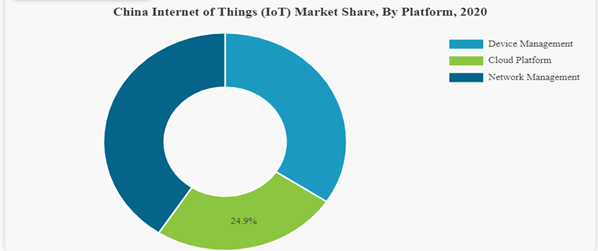
Of the global IOT market Asia Pacific region holds the maximum share of it due the rising number of smart city initiatives and cloud usage. Communication industries and service providers are reevaluating their data structures to incorporate IOT dives and technology in order to monetize the systems and data. As per the report of GSMA the largest world’s largest IOT market also exist in Asia Pacific region-China owns 64% of the 1.5 billion IOT connections (https://www.fortunebusinessinsights.com/industry-reports/internet-of-things-iot-market-100307).
Pie Chart is taken from the www.FurtuneBusinessInsight.com
Data science is changing the world. Its influence can be seen in modern-day luxuries. Big organizations across the public and private sectors are racing to utilize its transformative potential. In the healthcare industry, health informatics has dramatically improved the quality of patient care and resolved several complex issues.
Healthcare applications are aiding in early disease detection, help doctors identify at-risk patients, lower costs, drive innovation and discovery in pharmaceuticals. Health informatics will have a significant impact on the quality of healthcare in the coming years worldwide. Realizing the potential of health data, Scientia Pakistan magazine exclusively interviewed Dr. Suleman Atique, a health informatics expert based in Pakistan.
Dr. Suleman is working as an Assistant Professor of Health Informatics at the University of Ha’il in Saudi Arabia. Below are excerpts of his conversation with our Chief Editor, Saadeqa Khan.
Saadeqa: Let us know about your life and career? Who inspires you the most for an offbeat career like health informatics?
Dr. Suleman: I am from a small village in Mandi Bahauddin and had my primary schooling there. Later, I relocated to Lahore for college and then to Faisalabad for my undergraduate studies in pharmacy. My first encounter with a computer was at the university library, and it became stronger and stronger over time.
This was when I began to consider pursuing more education in fields other than pharmacy. Following that, I picked ‘Health Informatics’ as my major in my master’s degree at COMSATS University Islamabad (earlier called COMSATS Institute of Information Technology, Islamabad).
I received an international student scholarship from Taipei Medical University in Taiwan for my doctoral studies in Biomedical Informatics. I used to stay up to date on the latest advances in the health industry, which is how I became interested in health informatics. This, I believe, is the most excellent strategy to address disparities in the health sector in a resource-constrained country such as Pakistan.
Dr. Suleman is working as an Assistant Professor of Health Informatics at the University of Ha’il in Saudi Arabia.
For the past three years, I have been working as an Assistant Professor of Health Informatics at the University of Ha’il in Saudi Arabia. Before this post, I worked at the University of Lahore’s Institute of Public Health in Pakistan. In addition, I am a visiting lecturer at the Public Health Department, Universitas Negeri Semarang (UNNES) in Indonesia.
Saadeqa: Do you agree that data analytics and informatics are essential for properly managing a healthcare organization?
Dr. Suleman: Yes, data analytics provides an accurate view of an organization’s growth. Informatics provides instruments for data collection and analysis. It is critical to have up-to-date data to comprehend the work process in any organization. It is significant, yet it is the most overlooked aspect of the health industry in our area of the world. We must comprehend the potential of ICTs and how they might alter the health sector at a low cost.
Dr. Suleman: Informatics is the science of how data, information, and advanced knowledge improve human healthcare delivery. Let us know about its scope in Pakistan; which features are missing the most in our healthcare system?
Dr. Suleman: Data is the key, and it is as essential as oxygen. Data leads to information, which leads to knowledge. Unbiased data shows relevant information that reveals the status of any firm. To improve our healthcare system, we must prioritize data collection.
The majority of tasks in our healthcare system are still done manually. The healthcare system has the potential to be radicalized if it is digitized. As a result, we must focus on the digitalization of the health industry. This must begin with basic health facilities and progress to specialized hospitals.
I usually avoid discussing and disseminating such things. Unless things aren’t moving in the right direction, I usually give my team members free rein. I am usually a good listener in a team and prefer a mix of hard and intelligent work.
Saadeqa: Which factors do you consider determine patient care standards? How does a patient’s case history help to recognize the roots of a disease?
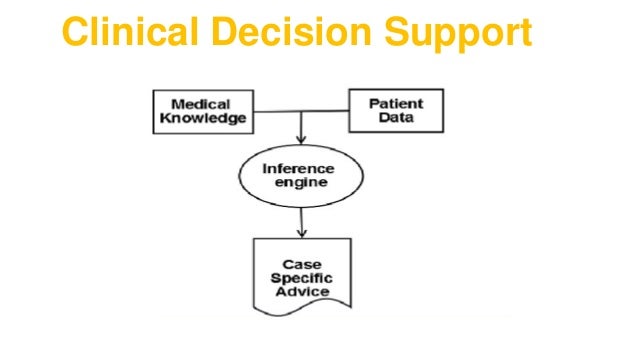
Dr. Suleman: Patient case history is essentially an indicator of one’s own health status. Minute changes in the physiological data indicate data from several laboratory tests. A clinical decision support system (CDSS) can process changes in a person’s physiological state and aid in illness diagnosis and progression. As a result of advances in health informatics, several systems are now available.
Sadeqa: Can you tell us about when your analysis/ research led to a significant breakthrough in informatics?
Dr. Suleman: During my doctoral studies, I looked into the epidemiological statistics regarding dengue outbreaks in Pakistan. For nearly a decade, I created GIS maps to show dengue case data. GIS mapping of dengue at the provincial level was a first. It aided in determining which locations needed more significant attention to avert repeat outbreaks. In Pakistan, we also discovered that males are more exposed to dengue than females, in contrast to the rest of the world.
A clinical decision support system (CDSS) can process changes in a person’s physiological state and aid in illness diagnosis and progression.
Saadeqa: Share with us an experience when you gathered information from multiple resources. How did you determine which source was relevant? How do you balance cooperation with others and independent thinking?
Dr. Suleman: To me, the source of information is unimportant; what matters is its authenticity. For example, at the beginning of COVID-19, some research claimed that antimalarials could cure COVID-19. Still, I found it difficult to believe based on research, and I usually avoid discussing and disseminating such things. Unless things aren’t moving in the right direction, I usually give my team members free rein. I am usually a good listener in a team and prefer a mix of hard and intelligent work.
Saadeqa: How does informatics help to cope with the challenges like medical errors, retrieving medical records, and ensuring quality and safety in health services?
Dr. Suleman: Medication mistakes were a major driving force behind creating computerized physician order entry systems (CPOE). In the United States alone, medical errors are responsible for an estimated 250,000 deaths per year. In a country like Pakistan, where no such data is available, one can estimate the harm it poses.
To avoid such challenges, digitizing the health sector from its very foundation to its pinnacle is critical. Informatics tools not only detect potential medical errors but also notify users when they are corrected. Manual manipulation of health data poses hazards and may result in unforeseen outcomes. Informatics tools aid in the efficient collecting and retrieval of medical records.
One of the leading causes of medication errors, particularly in chronic patients, is a lack of medication reconciliation. CPOE can effectively address this issue. Furthermore, it can collect all information on a patient in one place, reducing the possibility of overlooking critical aspects of patient profiles when prescribing or providing medications.
Saadeqa: Let us know the impact of health informatics on malpractices in labs and hospitals/healthcare centers?
Dr. Suleman: Medication errors in health care organizations play a significant impact in increasing mortality in both inpatients and outpatients. These inaccuracies are the result of human error. The use of digital systems in the health sector can significantly reduce these risks, perhaps saving many lives.
The use of a computerized physician order entry system (CPOE) can help to reduce these errors and alert practitioners to potential errors. When combined with CPOE, clinical decision support systems (CDSS) aid in making better clinical judgments and reducing medical errors.
As we all know, the majority of healthcare costs in Pakistan are borne by patients. Duplication can reduce lab tests data by applying informatics tools, which will reduce patients’ treatment costs and make it more cost-efficient for them.
When we use health informatics technologies, it is easier to conduct public health surveillance. Over-prescription of medications, particularly antibiotics, is a natural hazard to humanity; it is a global threat that can be controlled by using CPOE and calculating Defined daily doses (DDD) of antibiotics.
Saadeqa: What would you like advice for early career researchers in health informatics? What is next for you?
Dr. Suleman: The next generation of health informaticians must concentrate on healthcare data analytics. This is where Pakistan falls short the most. The two most important fields of informatics are data analysis and visualization. Pakistan is still a newcomer in this industry, yet there is enormous promise.
Furthermore, the government should strengthen the institutes that provide education in this field. There is only one university in the country that offers a master’s degree in health informatics. There is a need to provide this subject in more institutes. The higher education commission of Pakistan must recommend including health informatics as a subject in all the healthcare and allied healthcare programs at the bachelor level.
In the future, I hope to develop a health informatics research group where we can train the next generation of researchers.
The Imitation Game is a story of a lonely genius who single-handedly did a very important piece in the cog that was the wheel for taking on the Nazis. This movie is based on a true story that makes it even more captivating. It beautifully tells the untold story of Alan Turing that most of us weren’t aware of. What Alan is doing in this movie is arguably one of the most important things that were happening in World War II to beat the Nazis.
Directed by Morten Tyldum and written by Graham Moore, The Imitation Game is a historical drama that takes place in World War II, starring Benedict Cumberbatch as mathematician/cryptanalyst Alan Turing. And Keira Knightley, Matthew Goode, Rory Kinnear, Charles Dance, and Mark Strong appear as supporting actors.
The story pans out at the time of world war. Soldiers in the field are being slaughtered brutally. The Nazis are communicating via codes. The Germans have successfully created a machine, living up to its name, called “Enigma.” This machine makes codes that are unbreakable, and no one knows how to solve the puzzling pieces. It’s like the free world’s key to defeating the Nazis is by cracking this code. It comes to code breakers to find the patterns and decipher the messages.
The enigmatic problem is that the code resets every day so that when every time someone gets close to cracking it or breaks through a couple of messages, BOOM! The code changes to a new one in a few hours, and all that work done previously is just gone. At that time, there weren’t a lot of machines, so they were trying to break the code by hand. Manually it would have taken an awful lot of time.
The Imitation Game is a historical drama that takes place in World War II, starring Benedict Cumberbatch as mathematician/cryptanalyst Alan Turing.
In comes Turing, who takes it upon himself to crack the code regardless of what everyone keeps on saying. Turing gets an idea that what if he can build a machine that adapts to code, and it can crack every code that enigma generates and makes forever. And that’s ultimately the movie. It is some next-level brilliance in terms of genius.
It is to be noted that the acting in this movie is fantastic. Benedict Cumberbatch is excellent as always. Surprisingly, supporting actors such as Keira Knightly are also very great in this movie, giving stellar performances.
I’m a fan of movies that are intensely intriguing without much action. In this movie, people kept discouraging Turing, insisting that whatever he is building is useless. But the passionate fellow stood his ground. “IT WILL WORK,” he kept on saying, but unfortunately, people didn’t understand it at that time. It’s frustrating to see this genius who knows what he’s doing, trying to explain to common folk (like us) what he’s trying to do in a world where those new concepts and ideas didn’t exist.
In short, The Imitation Game has great acting, great characters, with a fascinating story. I loved how mathematicians did their thing and brought it to the level where you get irritated by the fact that why is no one taking them seriously. It was infuriating to see that except a few people, no one paid heed to him at that time, but he successfully invented the machine that was so cool that it became the stepping stone of a new era in computing.
This was one of those flicks that really plays with the emotions of the audience instead of throwing in shallow action. I highly recommend watching this movie. It is an inspirational story and gives you hope that anything can be achieved when you put your mind and heart to it, no matter what the circumstances are. More importantly, it lets you experience those elements of the war that remained unnoticed for years.