Data Science is considered one of the lucrative and challenging job fields in the 21st century. This is an era where data itself is viewed as the modern world’s most precious resource. From healthcare to law, to industries or transportation, data sciences experts and professionals play a vital role in every sphere of life.
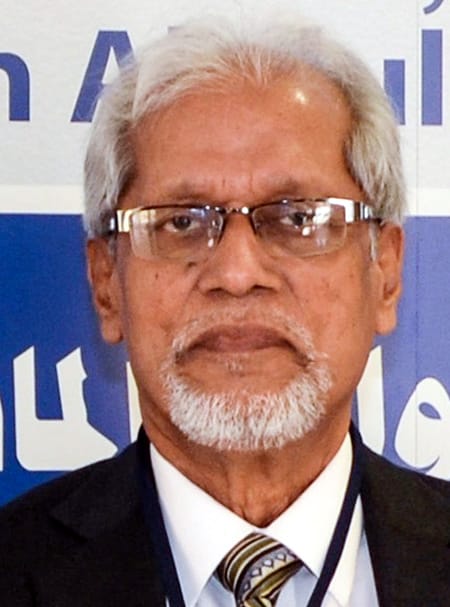
At Scientia, we had the privilege of discussing Data Sciences with Prof. Murtaza Haider for our special edition on data sciences. Murtaza Haider is a professor of data and real estate economics at Ryerson University, Toronto, while holding an adjunct professorship in the Faculty of Engineering at McGill University.
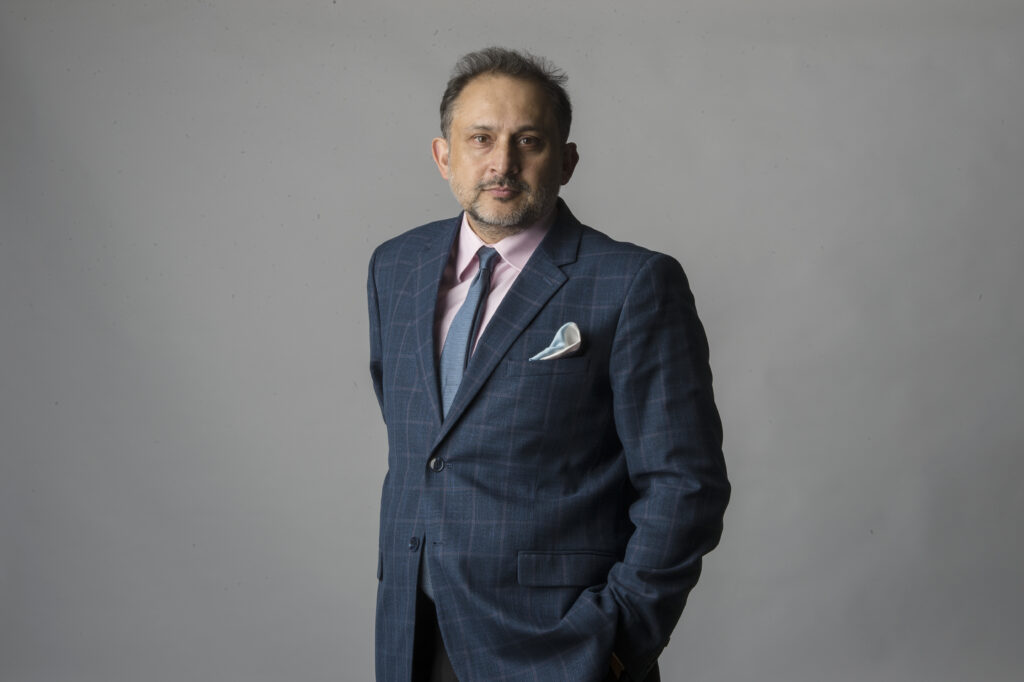
Additionally, he serves as the Research Director at Urban Analytics Institute while also leading Regionnomics.Inc, a firm specializing in the economics of cities and regions. Dr. Murtaza has diverse research interests and is a thought leader in business analytics, data science, housing market dynamics, transport/infrastructure planning, and human development in Canada and South Asia. He relies on “Data-Driven Analytics” to support his arguments, designs, and overall writings.
Dr. Haider is an author of two books: “Real Estate Markets: An Introduction” (2020) and “Getting Started with Data Science: Making Sense of Data with Analytics” (2016).
Our conversation with Dr. Haider focused on data science and analytics and their relevance for Pakistan.
Fouz: What made you decide to become a data scientist? How do you manage to overcome career obstacles?
Dr. Haider: Well, it was only when I started pursuing a Master’s degree at the University of Toronto when I started working with big datasets, specifically the housing sales data. Interestingly, my Master’s thesis was focused on developing hedonic price forecasting models. For that, we had data sets of nearly half a million properties. It was the late nineties, and working with such sized data sets was relatively uncommon.
Back then, I didn’t even know that I was working in Big Data or Data Science. Later my fascination continued with data. When I joined McGill University as an assistant professor, I worked on building a traffic forecasting model. My lab created a large model with almost every street in Montreal; the model covered around 130,000 streets, each with two-directional traffic, and we were able to forecast traffic, congestion, and emissions for every street in the city.
Since then, I have worked on numerous projects involving big and small data sets. I didn’t have any obstacles in my career. I have been an inquisitive person. So, I am driven by questions. Especially, If I have a question that I cannot readily answer, I can’t sleep until I find a clue or find some datasets and start exploring for answers. Personally, it never occurred to me that I was trying to become a “Data Scientist”; all I had was a curious mind, lots of unanswered questions, and I kept going on one problem after another. I didn’t stop.
Fouz: How do you relate Data Science to Pakistan?
Dr. Haider: Data and facts matter for Pakistan, even more so now than before. “Facts are sacred.” Why? Because when we argue with data, consensus emerges organically. For example, in Pakistani talk shows, we see people hurling allegations and making huge claims about each other about the corruption of billions of dollars. Without evidence or solid proof, how could someone claim that their opponents have looted billions of dollars? When data and facts are missing, how could one prove such an allegation? Since we do not have a data culture in Pakistan, it is effortless to accuse someone falsely or without evidence.
If people realize that Pakistan’s economy of $278 billion is small relative to other advanced economies and that stealing billions of dollars from such a small economy will be quite difficult even if allegations of theft and corruption were true. Furthermore, one cannot steal billions of dollars without leaving several paper trails. What data science offers in this context and perspective. Understanding the size and scope of an economy with data would help one understand the scale of rent-seeking that might have happened or otherwise in a corruption-infested economic system.
I teach in my data science courses not only about numbers or methods but also about critical thinking, where we must establish the facts and understand the context. We must keep our sights on the available data and evidence before coming up with a huge claim.
So, data science is all about finding evidence. We can structure our arguments and deliberations with data and facts. If people are required to back their claims with data and facts, lots of conflicts we see in society can be resolved.
Consider that Pakistani courts are burdened with lawsuits related to land and property. A reliable and comprehensive database of land and property registration could help ease the judicial gridlock in Pakistan.
Fouz: Your profile shows interests in diverse fields like data science, urban planning, transportation, real estate, and human development. What do you like the most about your job and interests?
Dr. Haider: My area of research is about the economics of cities, which includes transportation, housing, labour markets. Then, also being a professor, I have worked on the management of higher education. I pursue all my research interests with data. I wouldn’t say that every problem can be solved with data. But, for any questions, we can easily find an answer with data. In summary, I research and write about matters that concern the economics and wellbeing of cities.
Fouz: How does your typical day as a data scientist look like with new-normal after the Coronavirus pandemic? How would you manage work at home?
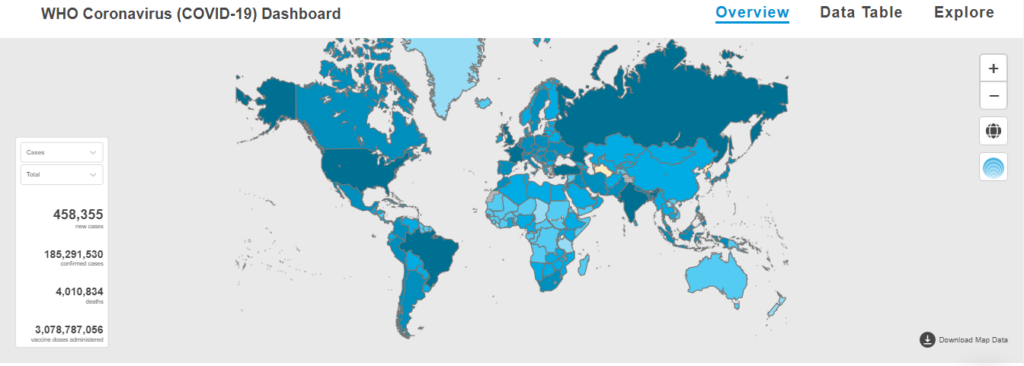
Dr. Haider: The pandemic has made almost everyone aware of data and its usefulness. When people talk about COVID-19 positivity, they are speaking about data and metrics. When they refer to flattening the curve, they are speaking in data terms about limiting the spread of the disease. People who have never worked with data have now learned about the importance of data because of the pandemic.
One of the positive outcomes of the pandemic is that some aspects of planning have become data-centric. For instance, city governments and health professionals must look at data to decide whether the city or the province should be put under a complete or partial lock-down. Experts and citizens are looking at metrics like the positivity rate, what percentage of emergency beds are occupied, and the availability and production of Oxygen. I believe that even after the pandemic is over, we will continue relying on data-driven approaches to planning for health and expand the use of data to other disciplines.
Fouz: Harvard business school recently called data science “the sexiest job of the 21st century”. Let us know what led you to write “Getting Started with Data Science” and how this book helps early-career data scientists?
Dr. Haider: Yes, the book took several years to plan and write. The main reason for writing this book was to help those with data and analytics who were already employed and interested in data science but could not return to school full-time. I believed that if someone works for a firm and wants to acquaint themselves with data science, there should be a book for them. So it is not necessarily a textbook. It’s a book about maneuvering for people who are already employed and are interested in data science to reorient their careers with data. It is also a resource for those students who may not have studied math-centric subjects but still are curious about learning data science.
Fouz: How does data science help understand developing cities better, especially in developing countries like Pakistan, where there are no strong roots of the field?
Dr. Haider: Data and data-driven urban planning are relatively disadvantaged in Pakistan. You will appreciate it when I share a North American example with you. For instance, if I need data for a city in Canada about the location of roads, bridges, employment centers, shops, and housing, I can get it from the government for free using the government’s open data portals or buy it from a software or data vendor. The entire data for the US census is available at the neighborhood level for free for those interested in exploring it.
The establishment in Pakistan will have to change course regarding data, its use and availability. A few years ago, Pakistan’s Parliament passed a law that made digital map-making illegal. This means that one cannot develop a map without the government’s approval. I think the government should create an open data portal to release data rather than caging it.
Students in Pakistan are disadvantaged because they don’t have relevant data for Pakistan to conduct research. I experienced it when I taught courses and workshops in Pakistan. I don’t have data for Pakistan to teach data science or analytics. So it’s not helpful that I have to use data sets from the US and other places to train learners in Pakistan.
We desperately need visionary civil servants and political leaders to pivot the government’s approach to data liberation.
The pandemic has made almost everyone aware of data and its usefulness. When people talk about COVID-19 positivity, they are speaking about data and metrics.
We must know that banning map-making in Pakistan hurts only Pakistanis because the rest of the world has access to spatial data on Pakistan. For instance, you can consult the spatial data library in any medium-sized or more prominent university in Europe and North America to download spatial data for Pakistan at 1- or 10-meter resolution. The rest of the world can avail this opportunity but not the learners in Pakistan.
I also believe strongly that the Federal Bureau of Statistics and the Planning Commission should make the census data available to researchers and universities. I visited Pakistan in 2003 to train the staff in Geographic Information Systems (GIS) at the population Census Organization. The intent was to replace the approximately 125,000 hand-drawn with GIS-enabled digital maps to help analyze data from the 1998 Census.
Unfortunately, not much came out of that initiative once I left, despite the dedicated efforts of our colleagues at the Population Census Organization. Other government agencies intervened and prevented the PCO from developing the analytic capacities. That was a huge mistake, and we can see the downside that Pakistani universities have no access to the Census data at the neighborhood level. Without data, we are clueless in planning. Hence, I plead that census and other government-held data, such as an anonymized version of the data from BISP (Benazir Income Support Programme and its newer incarnations) be made available to researchers and universities.
A few years ago, an article in the Economist magazine explained why so much research was being done about the US? It is not just that the American researchers are busy exploring socio-economic challenges in the United States with data and analytics, but also researchers from Canada, Europe, and other countries are exploring solutions for American challenges. Hence, when one compares published research about the socio-economic challenges in the United States, one sees that such research is far more frequently available about the US than research on other countries and regions. The Economist explained that one of the enabling reasons for research being done on American challenges is that the data are readily available about the socio-economic challenges in the United States.
All I hope is that intelligent people in Pakistan should realize that one of the most significant services the people in power can do for Pakistan’s future learners, scientists, engineers, statisticians, and economists, is to make data available to those who want to research Pakistan.
Fouz: What has been your experience in working with data about Pakistan, whenever it was possible?
Dr. Haider: It gives me a tremendous amount of pleasure to work in Pakistan. I used to visit Pakistan during summers to teach at NUST. I designed and helped establish the National Institute of Urban Infrastructure Planning at the University of Engineering & Technology in Peshawar and have worked on several projects with the Urban Unit in Lahore.
I’m pleased to share findings from a recent research project with the civil engineering students at the National University of Sciences and Technology in Islamabad. A group of five students and I obtained data on traffic collisions in Rawalpindi and Islamabad from Rescue 1122. We analyzed the 15,000 or so collisions and discovered ways to improve traffic safety in Pakistan.
We found that though large trucks constituted a tiny fraction of the traffic fleet operating in Rawalpindi, trucks were involved in more than 50 percent of the collisions involving fatalities. Furthermore, we also discovered using Geographic Information Systems that those hurt in traffic collisions in Rawalpindi Cantonment areas were relatively disadvantaged because of a lack of a trauma center. As a result, civilians injured in the Cantonment areas had to be transported to trauma centers in Rawalpindi city, which added travel time and put the injured at greater risk.
The work done with the students at NUST is a good example of using data and analytics to find solutions for serious issues, such as traffic safety.
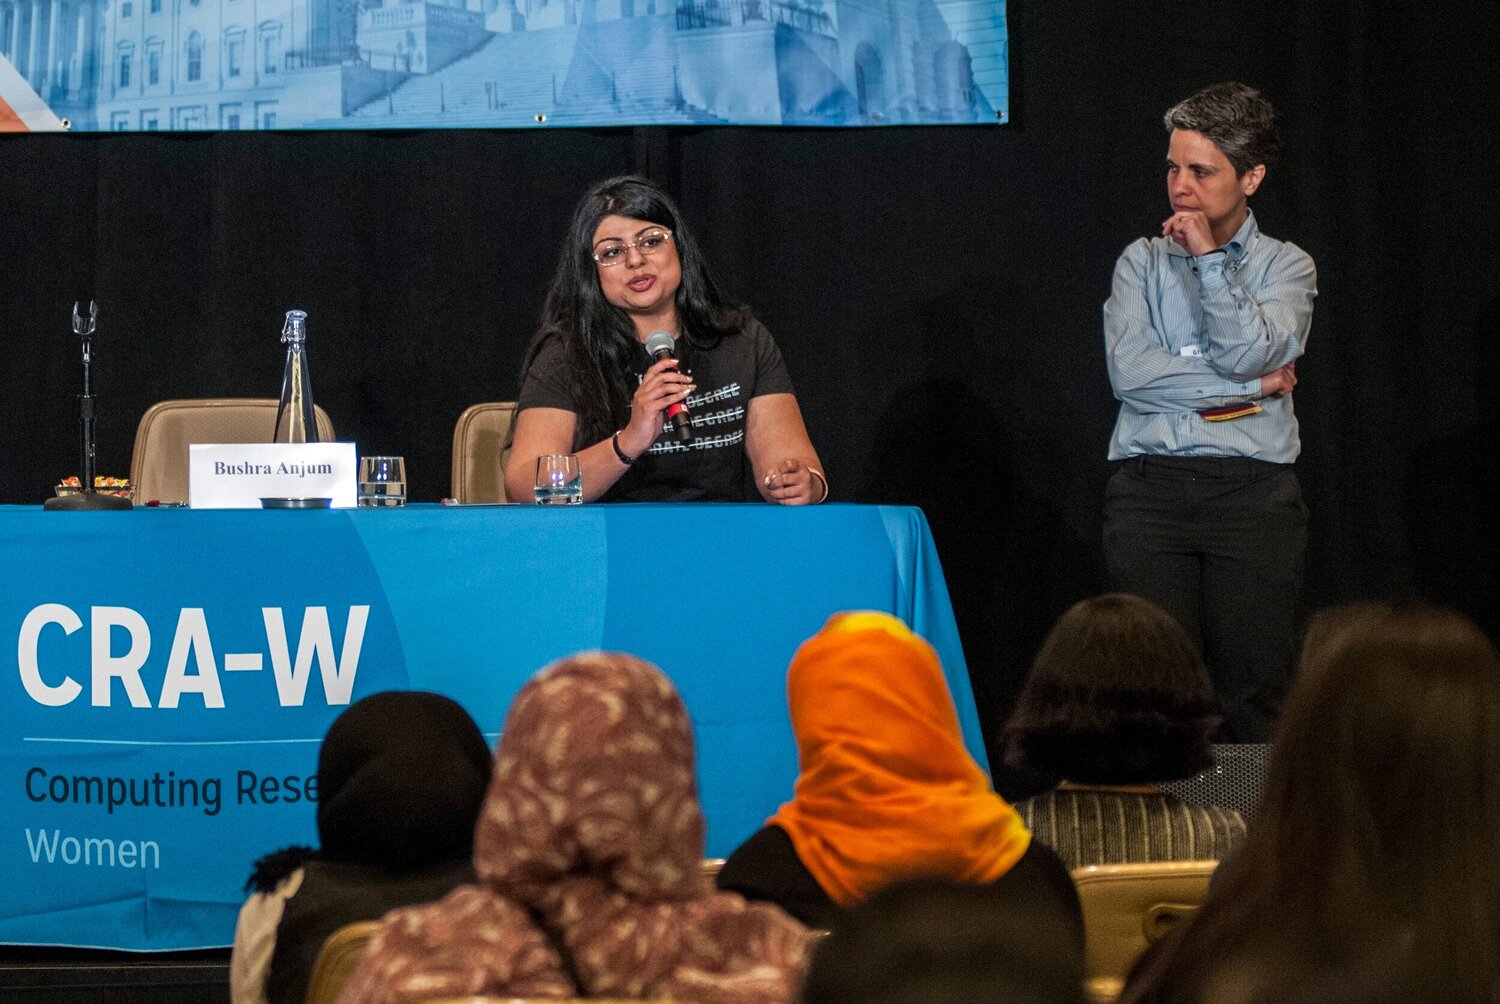
Also, Read: Talking data in healthcare and opportunities for women with Dr. Bushra Anjum